Trend reversal trading sounds straightforward on paper. Price goes up, then turns down. You catch the turn, ride the move, take profit. Clean.
In practice, it’s one of the hardest things to do consistently — because most traders aren’t actually spotting reversals. They’re spotting pullbacks, calling them reversals, and getting stopped out when the original trend resumes.
That single confusion costs more money than almost any other mistake in technical analysis.
The Pullback Problem Nobody Talks About Enough
Here’s the distinction that matters and gets glossed over in most trading content.
A pullback is price taking a breath. The trend is intact. The move against the primary direction is temporary, usually shallow, and often finds support at a moving average or a previous structure level before continuing. Traders who fight pullbacks thinking they’ve caught a reversal are essentially shorting a healthy uptrend. That ends badly.
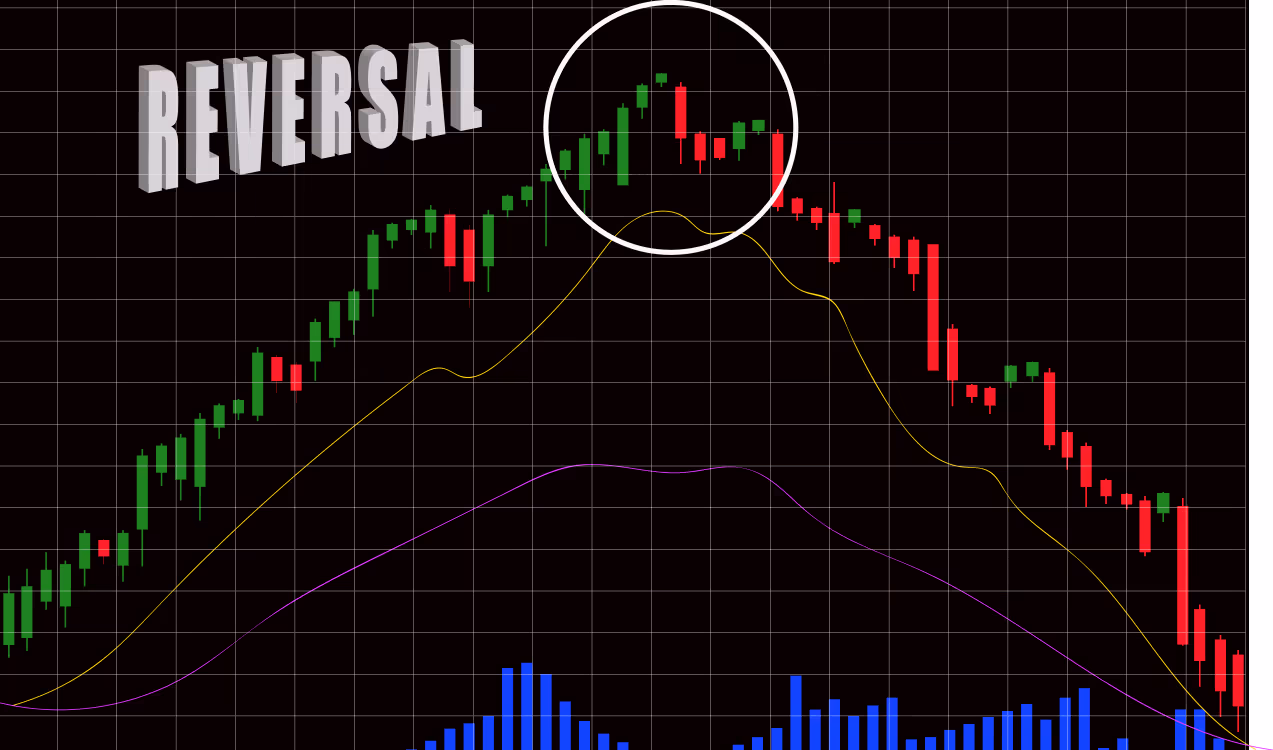
A genuine trend reversal trading setup looks different. Price doesn’t just stall — it breaks structure. In an uptrend, that means a lower high forms, then price takes out the most recent swing low. The pattern of higher highs and higher lows that defined the uptrend has now been violated. That’s not a pullback. That’s a character change.
Most traders see the first big red candle and start shorting. Smart traders wait for the structure break. One extra day of patience, sometimes two, saves them from a string of false entries.
What RSI Divergence Actually Tells You
RSI divergence is probably the most talked-about trend reversal trading signal out there — and also the most misused.
Here’s how it works in plain terms. Price makes a new high. RSI makes a lower high. That mismatch is bearish divergence. It means momentum is weakening even as price continues climbing. The buyers are still pushing price up, but with less force than before. Something is losing steam.
That alone isn’t a trade. Divergence can persist for weeks across multiple swing highs before price finally turns. Traders who short the first divergence signal on a strong uptrend discover this quickly and expensively.
What divergence does is put you on alert. It narrows your focus. You start watching that zone more carefully for the structural break described above — the lower high, the failed retest, the momentum shift that confirms the divergence meant something. Stack the two together and the probability of a real trend reversal trading opportunity improves dramatically.
Head and Shoulders: Reliable When You Wait for the Right Moment
The head and shoulders pattern has been in technical analysis textbooks for decades because it genuinely works — when it completes properly.
Left shoulder forms on decent volume. Price pulls back. Head pushes to a new high, but volume is lighter than the left shoulder. That’s already a warning. Price pulls back again, roughly to the same level as the first pullback. That zone becomes the neckline. Right shoulder forms — lower than the head, volume lighter still. Then price breaks the neckline.
That neckline break is the entry signal. Not the right shoulder. Not when you “think” the head is in. The neckline break.
The number of traders who enter during the right shoulder formation, get briefly right, then get stopped out during a retest of the neckline before the real breakdown — that number is enormous. Waiting for confirmation on this specific pattern isn’t timidity. It’s the difference between a trade with edge and a guess with a story attached.
Multi-Timeframe Confirmation Changes Everything
One timeframe is a fragment of information. Two timeframes is context.
When you’re looking for trend reversal trading setups, check the higher timeframe first. If the weekly chart shows a strong uptrend in full force, shorting a reversal on the daily chart means you’re fighting the bigger picture. Those trades work occasionally, but the failure rate is higher and the moves tend to be shallower.
The setups that really deliver are when the higher timeframe is already showing exhaustion — a long upper wick rejection at a major resistance zone, a multi-week consolidation after a big run — and the lower timeframe starts building the reversal structure. Daily divergence confirmed on a weekly level is a different animal entirely from daily divergence in isolation.
This is how professional traders filter noise. They don’t find a signal and immediately trade it. They ask whether the signal makes sense within the larger context first.
Risk Management in Reversal Trades Is Non-Negotiable
This part is short because it should be obvious — but it usually isn’t.
Reversal trades by definition go against the existing trend, at least initially. That means the natural price pressure is working against you until the reversal confirms. Stops need to be logical and respected, placed above the most recent swing high for a short, below the most recent swing low for a long.
If that stop distance requires more risk than you’re comfortable taking, the position size needs to shrink — not the stop. Moving stops to make a trade “fit” is how trend reversal trading turns from a strategy into a fast way to blow up.
The edge in this style of trading comes from patience and selectivity. Not every potential reversal is worth touching. The ones that line up across multiple criteria — structure break, divergence, pattern completion, higher timeframe context — those are the ones worth sizing properly.
The rest are just noise on a chart.
This content is for educational purposes only and does not constitute financial or investment advice.